small logo SETI League Photo Gallery

Satellite and Space Probe Signal Detections
link to Project ARGUS

(Click on thumbnail to download full picture)

Caution: be advised that these tend to be large files. Importing them will consume considerable Web bandwidth and connect time.

Attn. Journalists and Photo Editors: please check our Fair Use Policy before reproducing any of these images. Thank you.

See Also:

speakerAnomalous signal detected by SETI League member Trevor Unsworth on 10 May 1996, at 1471.5 MHz, using a surplus 3.5 meter dish. The signal exhibited clearly audible digital modulation, with a 270 Hz bandwidth. Its Doppler shift of -25 Hz/min marks it as RFI from a Low Earth Orbit (LEO) satellite. Though clearly not of extra-terrestrial origin, this signal gave Project Argus its first real workout, testing both the sensitivity of our receiving stations, and our ability to recognize terrestrial and satellite interference. It was later identified as emanating from a classified military satellite, as discussed in this associated editorial.
G0ECP image
G0ECP LEO signal

This CW signal from the Mars Global Surveyor was received by SETI League member Mike Cook on 25 November 1996, while the spacecraft was about 5 million km from Earth. The satellite's 1.3 Watt beacon transmitter, into an omnidirectional antenna, provided SETI enthusiasts with an excellent dry run to verify the operation of their receivers and digital signal processing software. Several other SETI League members were also able to recover the signal utilizing Mike's FFTDSP shareware program. See Mike's article for further details.
AF9Y image
AF9Y MGS signal

Member Gerry Cavan reports that even though the commercial venture has gone bankrupt, interfering signals from the 66 Iridium communications satellites at 1622 MHz are still easily received on his 10 foot diameter dish at Argus station EN92UX. The Low-Earth Orbit (LEO) satellites produce very rapid Doppler shift, as seen here. Current plans are to de-orbit these satellites (burn them up in the Earth's atmosphere) over a two to three year period.
VE3EYR image
 VE3EYR Iridium signal

The strong L1 (1575.42 MHz) downlink from GPS satellites continue to provide Project Argus participants with useful test signals. H. Paul Shuch caught his first complete GPS pass at Argus Station FN11LH on 14 September 1999. Paul writes, "From AOS to LOS was 32 minutes, during which the signal Dopplered just over 1 kHz (about 520 mHz/second). Close-in sidebands were clearly visible, and the SNR approached 10 dB with 10 seconds of integration. I ran a 16384 point FFT and a 11025 Hz sampling rate, which makes my bin width something like 673 mHz. This leads me to believe that integration was actually hurting the SNR, by spreading the signal across several adjacent bins -- and in fact, the visable display looks somewhat smeared. I believe that 1 Hz integration would have yielded a cleaner waterfall. Nevertheless, it's a thrill to see a signal rise out of, and then fall back into, the noise."
N6TX image
 N6TX GPS L1 signal

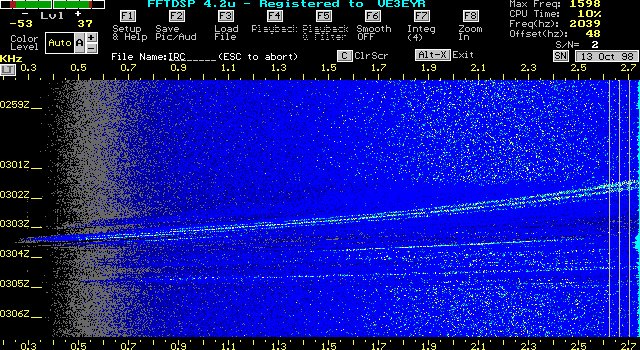
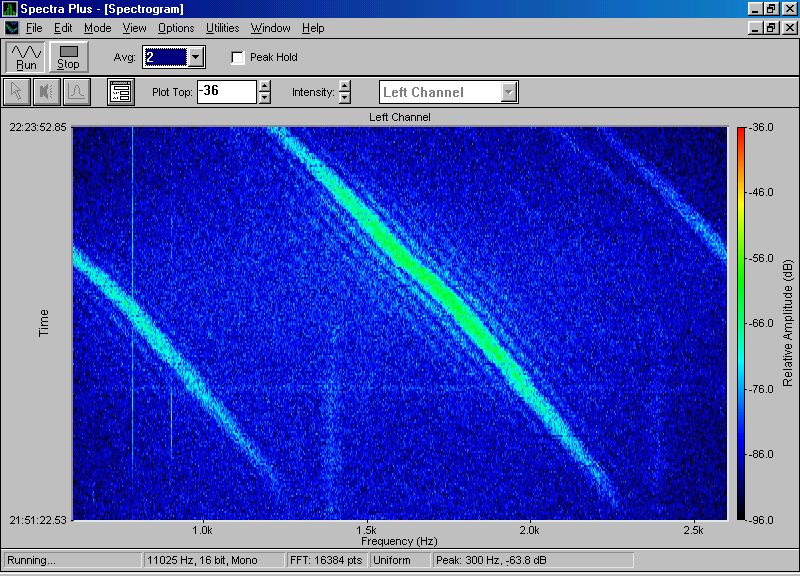
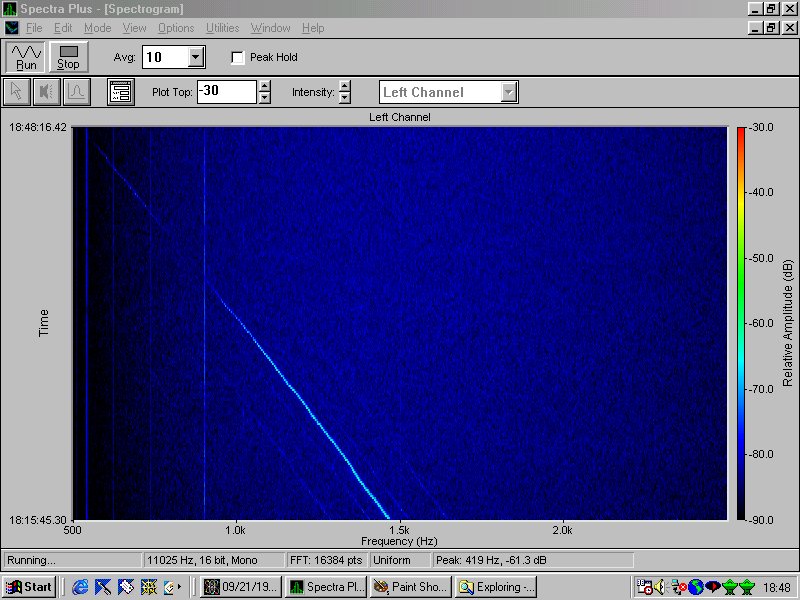
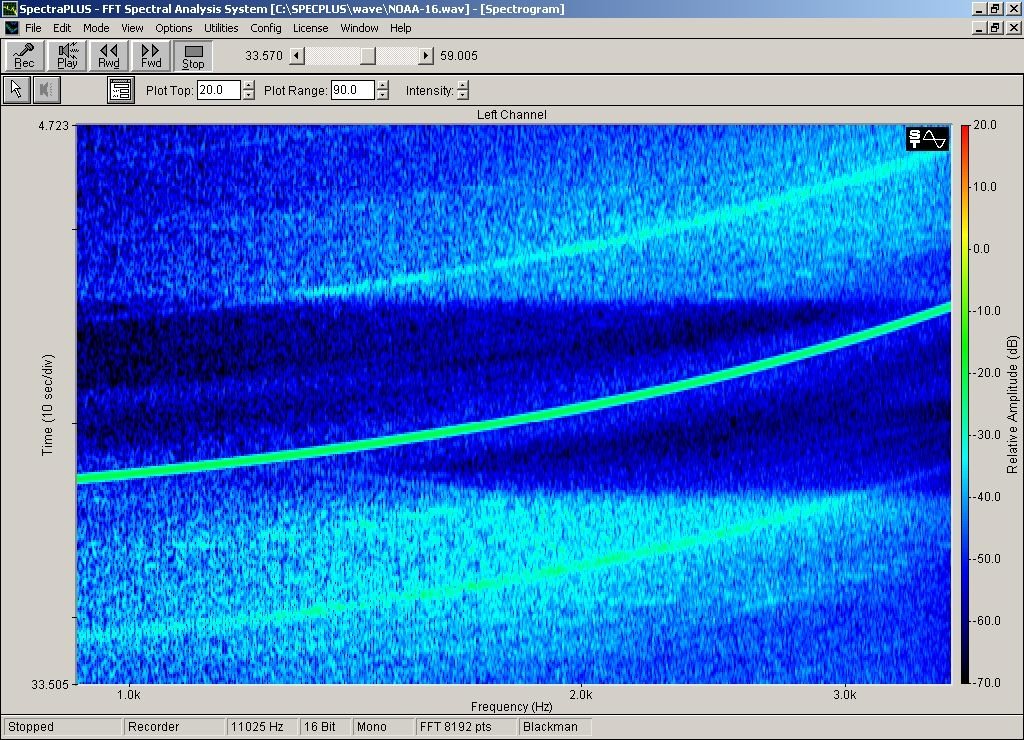
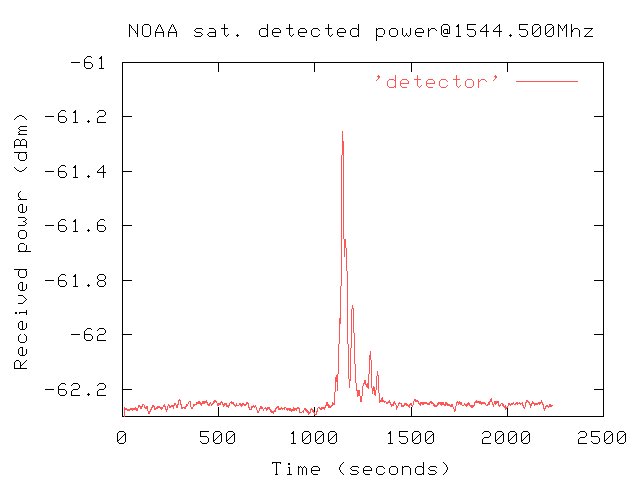
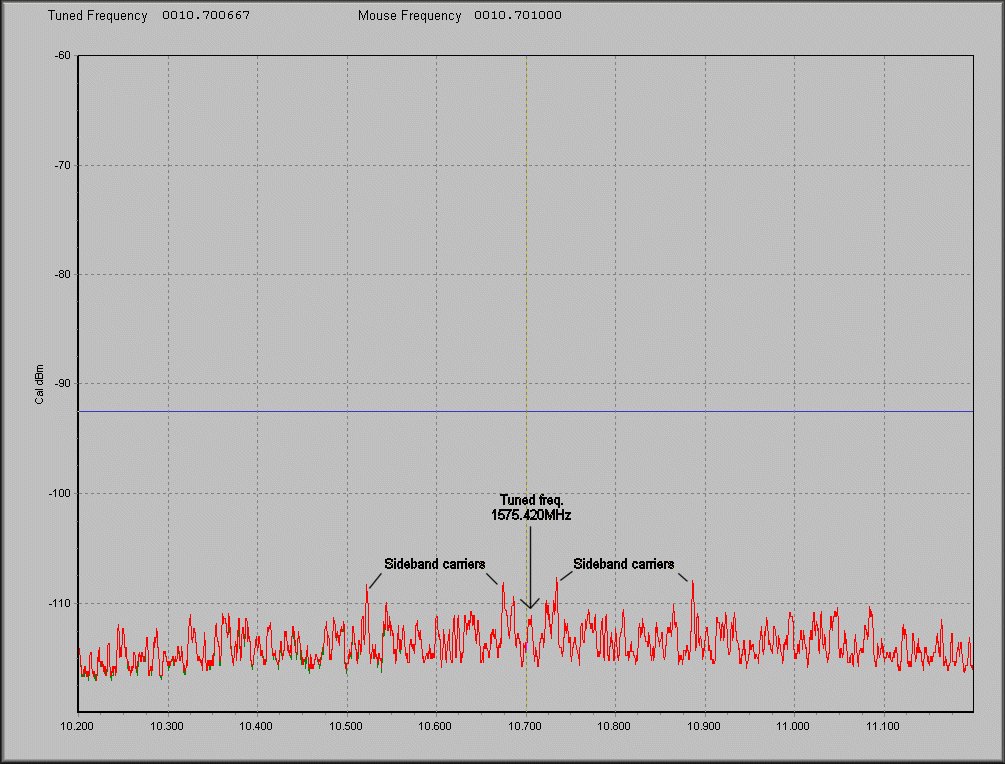
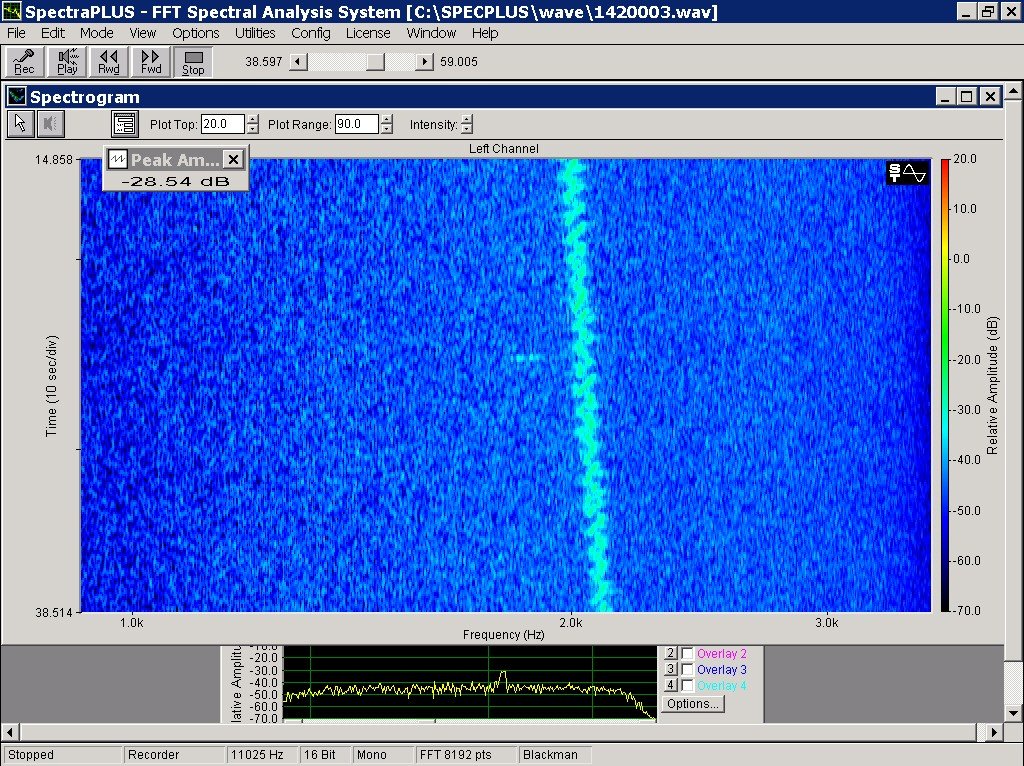
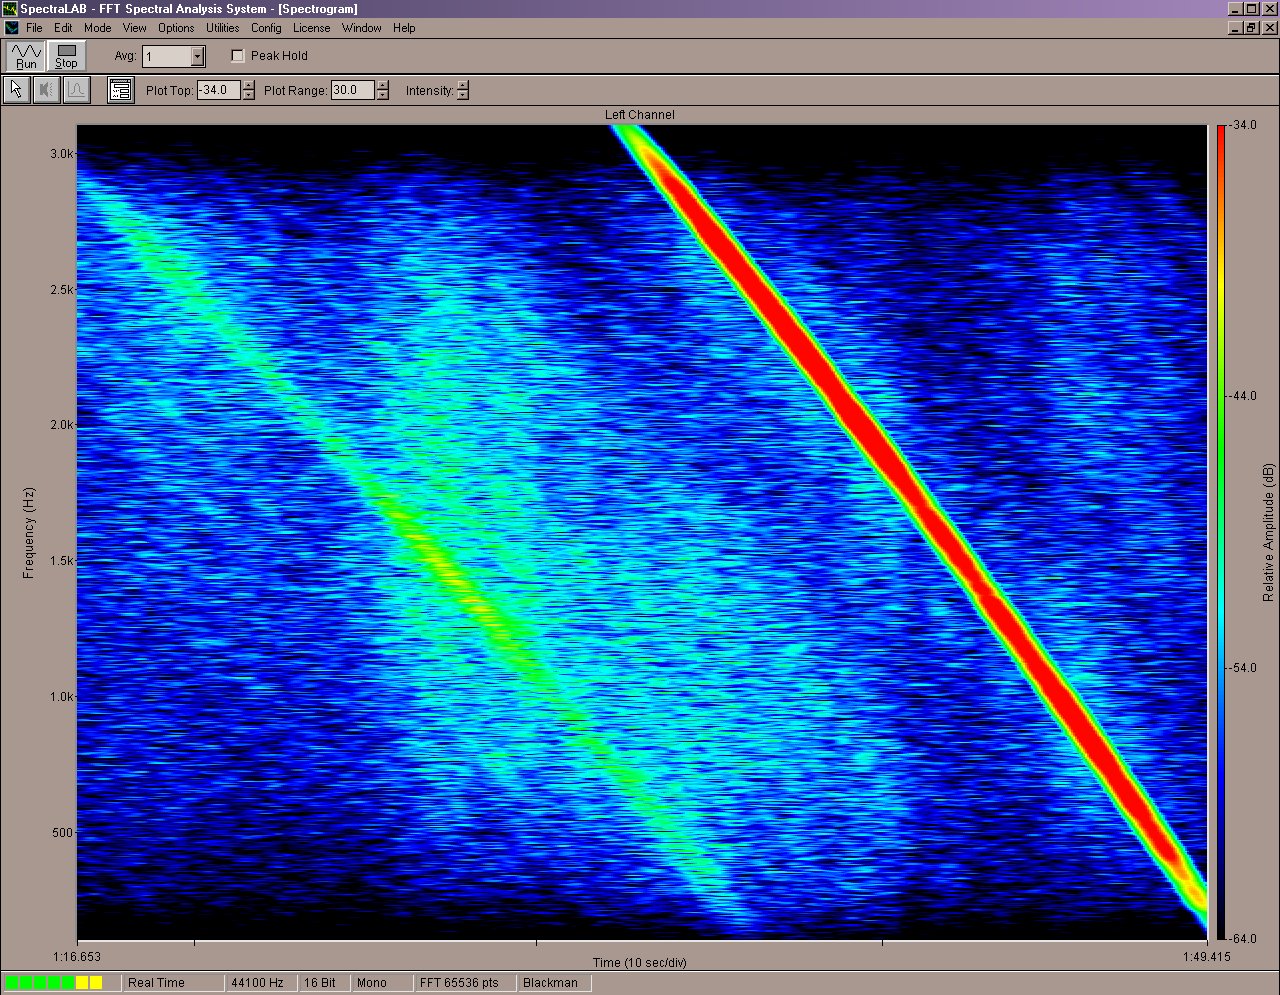
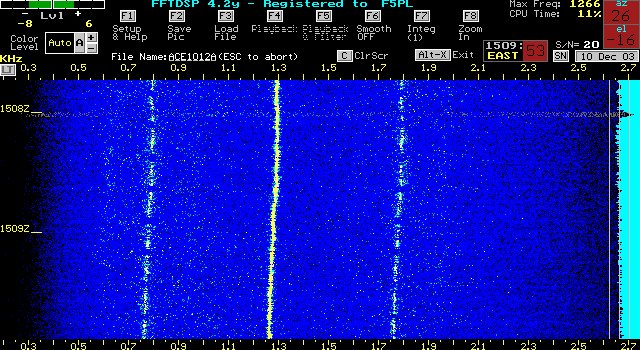
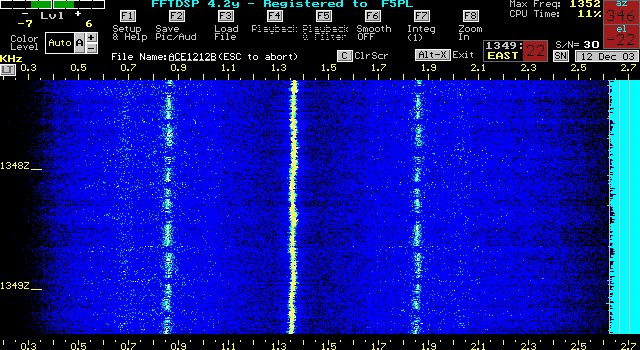
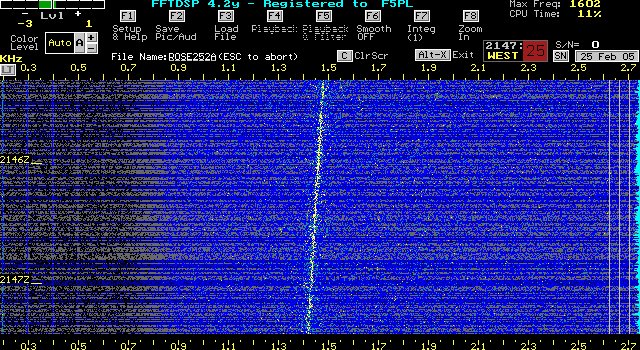
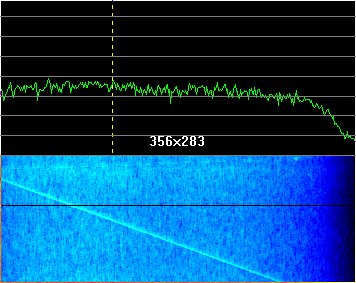
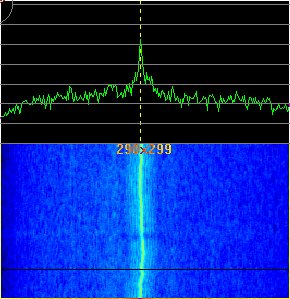
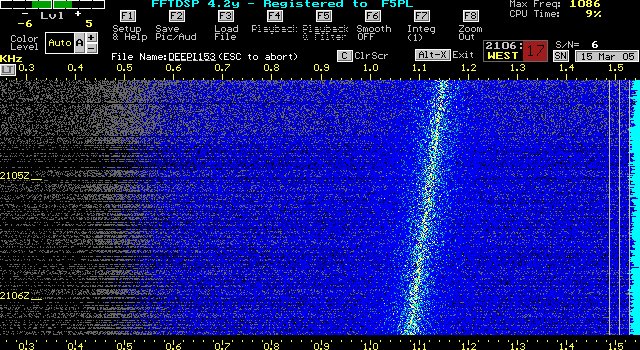
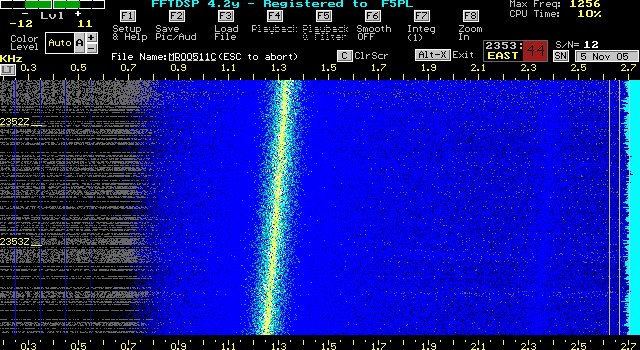
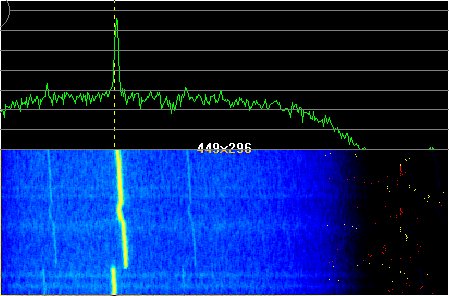
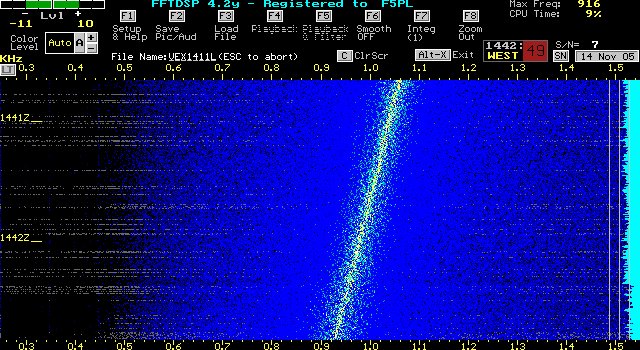
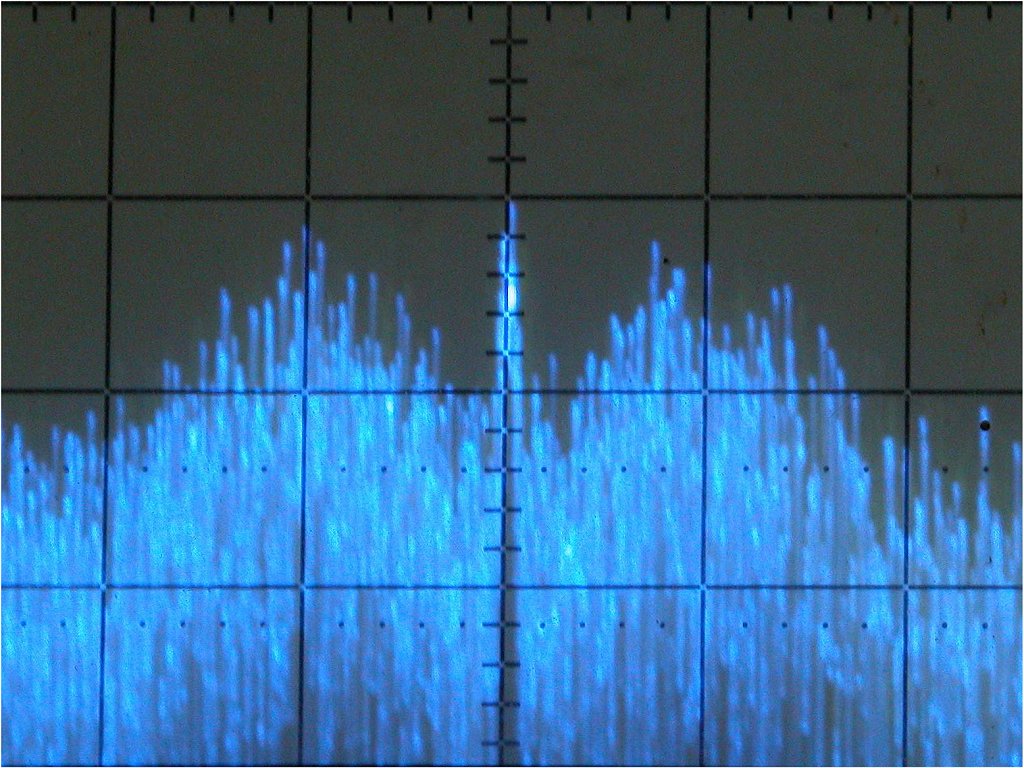
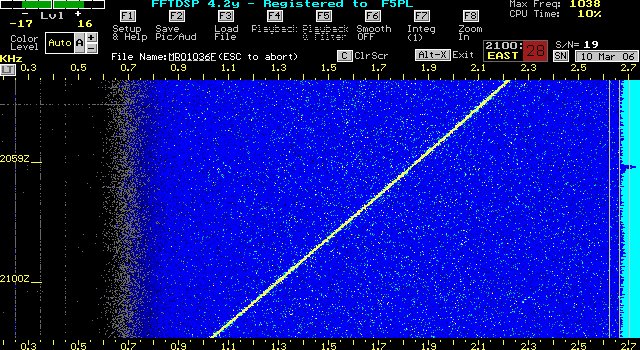
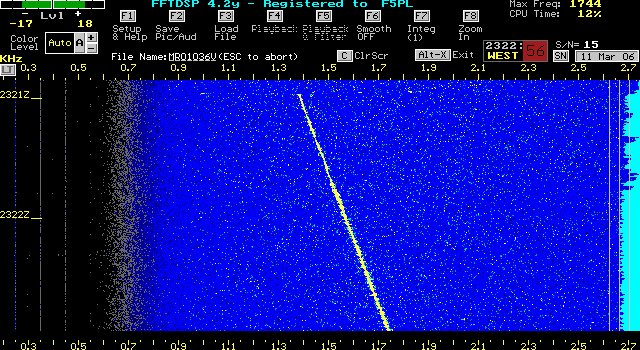
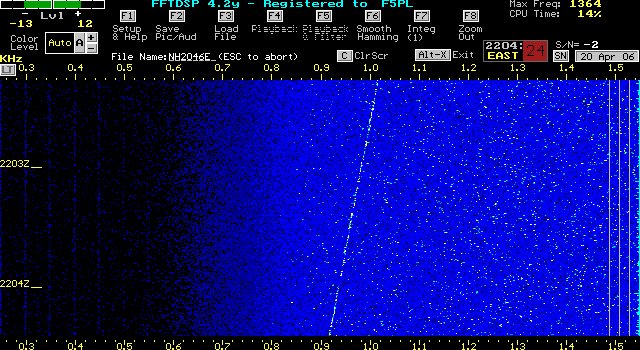
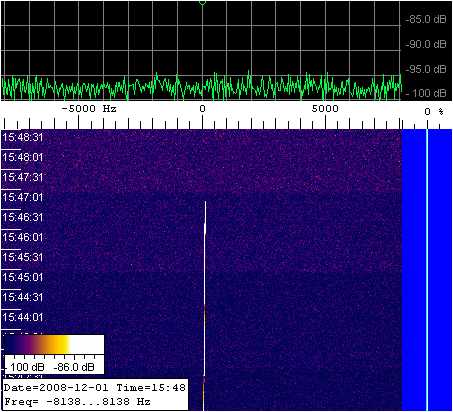
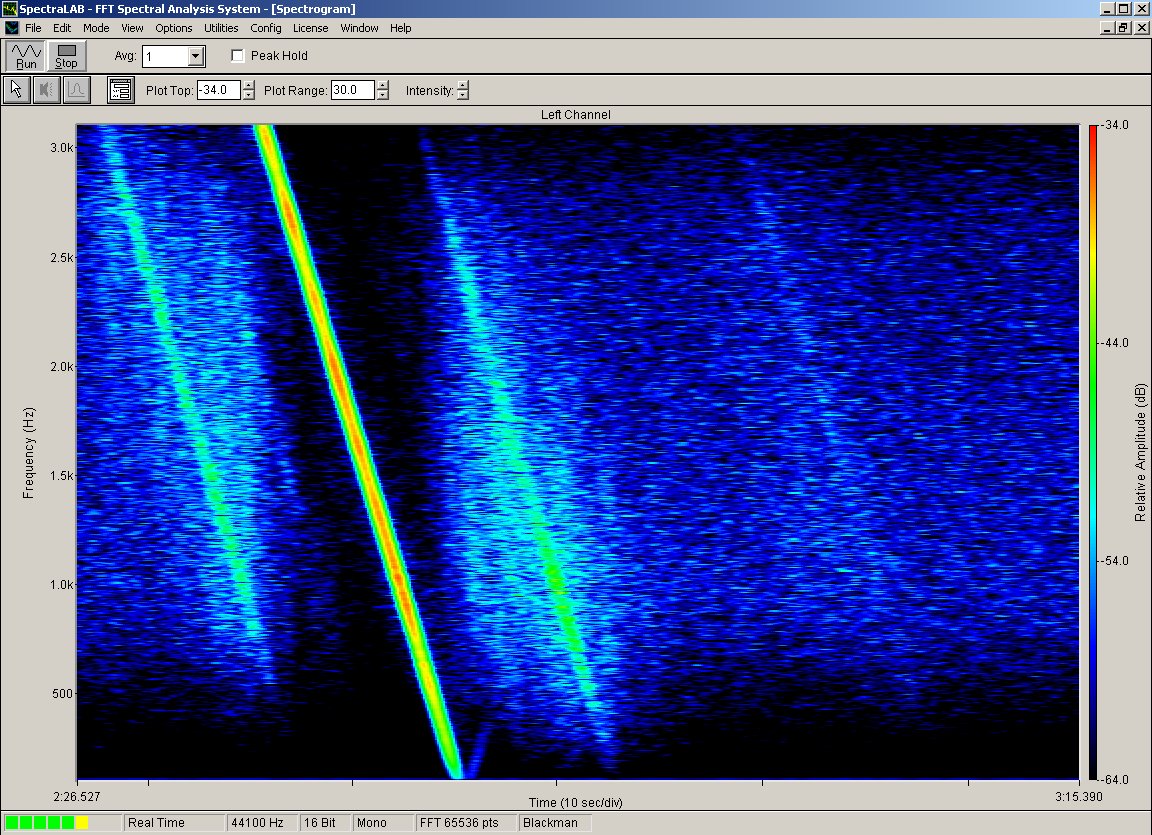
The GPS 1575.42 MHz L1 C/A +14.3 dBW carrier (see above) is spread by a 1.023 MHz chipping rate pseudo random code. This chipping rate results in a bandwidth of 2.046 MHz. By contrast, the 1227.6 MHz L2 P code signal (seen here) is modulated on a +8.1 dBW carrier at a 10.23 MHz chip rate with a resultant bandwidth of 20.46 MHz. Thus, the L2 signal is 16 dB weaker than the L1, and a real test of a SETI station's sensitivity. This L2 detection was made at Argus Station FN11LH. Note that the signal passes first through the antenna's main lobe, and then through the first sidelobe. (Sidelobe response was far greater than expected, indicating a need for repositioning of the feedhorn.)

GPS technical specs provided by Dr. Art Lange, W6RXQ, of Trimble Navigation.

N6TX image
 N6TX GPS L2 signal

Five watts from geostationary orbit produces an incredibly strong signal in our Project Argus stations. Seen here is the 2.4 kHz subcarrier from a GOES WEFAX (weather facsimile) satellite, received at Argus station FN11LH. Note that the spectrogram displays a vertical line, indicating zero Doppler shift (as is true of all signals emanating from the Clarke orbit belt.)
N6TX image
 N6TX WEFAX signal

Bertrand Pinel, F5PL (left), receives The SETI League's W2ETI Moonbounce Beacon with this seven-meter dish. He has also been highly successful at radio astronomy in the 1296 MHz amateur radio band, as well as a number of interesting interplanetary probes, at S and X bands. At right is the late Walter "Hoppy" Hopkins, N6BQ, who was long a prominent force in 1296 MHz amateur moonbounce activity.
F5PL photo
thumbnail

Strong GPS L1 signal at 1575.42 MHz, received with Argus station FN11LH's antenna straight up, in bird-bath position (drift scan mode). Tiled Spectra Plus screen shows time domain, frequency domain, waterfall and surface plots simultaneously.
N6TX image
 N6TX image

Weak, broadband GPS L2 signal at 1227.6 MHz, received with Argus station FN11LH's antenna straight up, in bird-bath position (drift scan mode). Tiled Spectra Plus screen shows time domain, frequency domain, waterfall and surface plots simultaneously.
N6TX image
 N6TX image

Argonaut Tom Hutter (station FN20ut) received this spectacular signal from the NOAA-16 weather satellite at 1544.5 MHz. He was scanning Dec +46.5 from longitude 74.3 West when the polar orbiter passed directly overhead on 19 October 2002, at 1826 UTC.
Tom Hutter image
thumbnail

Here's the exact same NOAA-16 signal as depicted above, this time analyzed by Peter Cheasley, VE2TPR, at Project Argus station FN35dm. Note that different software analysis tools bring out different signal features. Peter and Tom continue to collaborate in candidate signal analysis.
VE2TPR image
thumbnail

VE3MDL received his first GPS L1 image on a homebrew digital receiver in November, 2002. Marcus writes that he is "using the I and Q outputs of a DBS digital satellite tuner tuned to 1575.4375 Mhz. The actual S/N is about 10dB. The tuner is computer controlled (from Linux), along with digital RF gain setting and DC offset for the detector. A future instantiation of this will have a larger FFT bandwidth available (96Khz, instead of 48Mhz), which will allow seamless channel-to-channel coverage (the tuner has a channel spacing of 62.5Khz)."
VE3MDL image
thumbnail

Another VE3MDL detection with his homebrew digital receiver, this time of a NOAA polar-orbiting weather satellite at 1554.5 MHz. Marcus writes, "This is using my software-based power detection algorithm. The power level is referred to the input power to the sound card, not the antenna. The general shape is consistent with observations I've made using the baudline spectrum analyser. The integration time constant on this particular run was 10 seconds. The 'signal' constitutes a 0.1dB increase in received power--you can see that there's plenty of resolution available."
VE3MDL image
thumbnail

From Sweden, Argonaut Greger Gimseus sends us this spectrogram of a GPS L1 signal. He observes, "I took this 1MHz spectrum of a pass and there are four sidebands twice as powerful as the center-tuned carrier. You clearly see the center frequency isn't necessarily the strongest signal."
Greg. Gimseus image
thumbnail

Argonaut Tom Hutter detected this strange signal in January 2003. Its spectrograph (top) and Doppler pattern (bottom) are reminiscent of a signal detected by Project Phoneix at Parkes Radio Observatory in 1995, and dubbed the 'Big Zipper'. SETI Institute scientist Dr. Peter Backus recalls:
"The 'Big Zipper' turned out to be the Geotail spacecraft. It is a US/Japan mission to explore the outer regions of the Earth's magnetic field. The spacecraft is in a very elliptical orbit that goes out well beyond the Moon. On its way back toward Earth, it sweeps its carrier signal while waiting for a response from a ground station. I guess that once it gets a carrier from the ground, it locks on and transmits its data."
Tom Hutter images
thumbnail

thumbnail

From Argus Station JO89xw, Greger Gimseus sends these two images recovered from a NOAA weather satellite on 1544.5 MHz, using two different Icom receivers, an R-8500 (top) and a PRC-1000 (bottom). He writes, "one (the R-8500) has the AGC defeated (with 2.5vdc on the AGC out connector) and the other (the PCR-1000) has the AGC enabled. These spectra were taken simultaneously and you clearly see the benefits of disabling the AGC."
Greger Gimseus images
thumbnail

thumbnail

In France, F5PL first detected the Advanced Composition Explorer (ACE) spacecraft on 10 December 2003. ACE orbits the L1 libration point which is a point of Earth-Sun gravitational equilibrium about 1.5 million km from Earth and 148.5 million km from the Sun. With a semi-major axis of approximately 200,000 km the elliptical orbit affords ACE a prime view of the Sun and the galactic regions beyond. The spacecraft has enough propellant on board to maintain an orbit at L1 until ~2019. The signal is about six dB above the background (which includes significant sun noise) on Bertrand's seven meter dish. Frequency is approximately 2278.3587 MHz, with very little observed Doppler shift. The carrier and first data sidebands are clearly visible.
F5PL image
thumbnail

speaker By 12 December 2003, Bertrand Pinel's reception of the ACE spacecraft improved to +13 dB SNR, as its elliptical orbit of the L1 point moved it more than one degree above the Sun, as viewed from Earth. Click on the speaker icon at left to hear the audio signal of the spacecraft's S-band telemetry, as received on Bertrand's seven-meter dish.
(1033 kByte WAV file; 134 seconds)
F5PL image
thumbnail

In March, 2004, Bertrand Pinel F5PL detected the downlink signals from the European Space Agency's SMART-1 spacecraft, enroute to the Moon. Launched in October 2003 from Korou, French Guiana, SMART-1 uses a unique ion impulse engine, and after 15 to 17 months in transition between geostationary transfer and lunar orbits, is expected to orbit the Moon for at least six months. Its 2235 MHz telemetry downlink is received by Bertrand's 7-metre dish at greater than 30 dB signal to noise ratio! Note the significant Doppler shift in this spectrogram (indicated by the slope of the received signal).
F5PL image
thumbnail

20 March 2004

Bertrand Pinel is probably the first amateur to detect the 8.42 GHz telemetry downlink from the European Space Agency's Rosetta spacecraft. Launched on 2 March 2004 by an Arianne 5G rocket from Kourou, French Guianna, Rosetta is scheduled to reach Comet 67P/Churyomov-Gerasimenko in 2014. This detection was made on 1 February 2005, with the spacecraft 12 million km from Earth. In the spectrum analyzer image, vertical axis is 10 dB/div and horizontal axis is 200 kHz/div, indicating a total transmission bandwidth on the order of 600 kHz. From the observed Doppler shift, Bertrand was able to compute the spacecraft's velocity, to within 1% of NASA's published figure.
F5PL image
thumbnail

Here is a second X-band detection from the Rosetta spacecraft, sent in by Bertrand Pinel. This image was taken on 10 February 2005, with the spacecraft some 7.5 million km from Earth. The spacecraft had actually been traveling toward Earth, to do a gravity-assist maneuver enroute to the asteroid belt. In the spectrum analyzer image, vertical axis is 10 dB/div and horizontal axis is 100 kHz/div. The observed signal to noise ratio (SNR) exceeds +20 dB in a narrowband (SSB) receiver.
F5PL image
thumbnail

Yet another X-band detection of the Rosetta spacecraft, by Bertrand Pinel. This image was taken on 25 February 2005, during the close approach to Earth associated with its gravity-assist maneuver enroute to the asteroid belt. The slope seen on the waterfall display indicates the high rate of Doppler shift as Rosetta accelarates toward Earth.
F5PL image
thumbnail

This S-band (2296.851) reception of the Rosetta spacecraft, by Charlie Suckling in the UK, occurred on 4 March 2005, during the spacecraft's closest approach to Earth. Note the extreme slope seen on the waterfall display, indicating the high rate of Doppler shift due to Rosetta's extreme velocity.
G3WDG image
thumbnail

In order to detect the the Rosetta spacecraft during its flyby in March 2005, Bertrand Pinel modified his X-band dish feed (cylindrical waveguide with choke rings), turning it into a conical waveguide horn antenna. The spacecraft's velocity as it flew past Earth would have made tracking with a parabiolic antenna all but impossible.
F5PL image
thumbnail

speakerOn 15 March 2005, Charlie Suckling G3WDG became the first amateur to receive X-band signals from the NASA Deep Impact spacecraft, which was launched on 12 January 2005 on an intercept course with Comet Tempel-1. Click on the speaker icon above to hear the telemetry signals recovered during that reception.
(509 kByte WAV file; 32 seconds)
G3WDG image
thumbnail

18.9 million km from Earth, enroute to its rendezvous with a comet, the NASA Deep Impact spacecraft sent these X-band telemetry signals toward Earth on 16 March 2005. They were intercepted by Bertrand Pinel's 7 meter dish, only 4 dB above the receiver noise floor, on a frequency of 8435.3704 MHz.
F5PL image
thumbnail

Bertrand Pinel first received X-band signals from the Mars Reconnaissance Orbiter spacecraft on 22 August 2005. He writes, "Frequency ± 1 KHz = 8439.3315 MHz. Signal very tiny, just visible on the FFT screen, not in the loudspeaker. Doppler on the FFT screen not measurable, in accordance with NASA figures computed with Excel software. I assume the spacecraft working with a low gain antenna. About my antenna bearing, the signal is in total accordance with NASA ephéméris."
F5PL image
thumbnail

speaker Bertrand Pinel recovered 8420.4321 MHz signals from the Mars Express spacecraft some 81 million km from Earth, on 25 September 2005. He writes, "I received the telemetry carrier +5 db over noise, a good and strong signal in the loudspeaker during more than an hour, and the tracking is in total accordance with the red planet data from NASA ephemeris. I think that I was lucky because, at the moment of this reception, no data were perhaps transmitted, so the carrier was receiving the full output on frequency." Bertrand's 3.5 meter dish produces +46 dBi of gain, and his system noise temperature is 65 Kelvin. You can hear the high rate of change in Doppler shift in the accompanying WAV file, by clicking on the speaker icon above.
(1073 kByte WAV file; 133 seconds)
F5PL image
thumbnail

speaker Bertrand Pinel first received signals from the Mars Odyssey spacecraft in early October, 2005 as it continues in polar orbit around the red planet. He notes signals about one half dB out of the noise (much weaker than the other Mars probes he has detected), with immense Doppler shift, indicating a large relative motion between the spacecraft and Earth.
(1073 kByte WAV file; 134 seconds)
F5PL image
thumbnail

speaker By 5 November 2005, the X-band signals received from the Mars Reconnaisance Orbiter at F5PL had reached a signal to noise ratio (SNR) of +15 dB. Bertrand assumes that the spacecraft is now transmitting on its high-gain antenna. Note the extremely slow rate of change of frequency. The absolute Doppler shift is -247 kHz, with the spacecraft 36.6 million km from Earth.
(1003 kByte WAV file; 125 seconds)
F5PL image
thumbnail

speakerLaunched aboard a Soyuz-Fregat rocket from Baikonur, Kazakhstan on 9 November 2005, X-band telemetry from the European Space Agency's Venus Express spacecraft was received in England by Charlie Suckling G3WDG, Freddy de Guchteneire ON6UG, and James Miller G3RUH just five days later. Click the speaker icon above to hear their recovered signals.
(1073 kByte WAV file; 134 seconds)
G3WDG image
thumbnail

speaker In France on 14 November 2005, F5PL received X-band telemetry signals from the recently launched ESA Venus Express spacecraft. Bertrand observed a +22 dB signal to noise ratio in a 2 kHz bandpass. He noted periodic QSB (fading) +/- 2 dB in amplitude, suggesting the spacecraft is rotating on its axis at ~50 RPM. Received frequency is Doppler shifted ~75 kHz down from its nominal value of 8419.0741. The spectrum display (bottom photo) represents a frequency span of 200 kHz/div.
(1073 kByte WAV file; 134 seconds)
F5PL images
thumbnail
 
thumbnail

During the week immediately following the launch of the European Space Agency's Venus Express spacecraft, F5PL observed a periodic channge in the received amplitude of the telemetry carrier. The 300 mV p-p fluctuation (representing about 0.8 dB variation) repeats 50 cycles per minute, suggesting that the spacecraft is tumbling at a rate of 50 RPM. Bertrand produced this display by monitoring the DC output of his receiver's dB meter with an 8-bit ADC Picoscope (which he describes as "the Rolls of S-meters").
F5PL images
thumbnail

speaker F5PL caught these telemetry signals as the Mars Reconnaissance Orbiter fired its thrusters to decelerate on 10 March 2006. Doppler shift reverses direction in the two images, clearly depicting the change in relative velocity as the spacecraft first entered orbit around Mars, after an eight-month journey from Earth.
(1073 kByte WAV file; 134 seconds)
F5PL images
thumbnail
 
thumbnail

The NASA New Horizons spacecraft, now enroute to Pluto, was received at X-band by F5PL on 20 April 2006. Bertrand writes, "Very difficult to lock NH: the antenna must be aimed with a precision better than 0.1 ° angular. That's compulsory to do precise calibrations on the sun before tracking." He uses a 3.5 meter dish for the reception of various X-band space probes.
F5PL image
thumbnail

Bertrand Pinel was monitoring the European Space Agency's Venus Express probe with his 10 foot dish on 1 December 2008 at 15:46 UTC, when the 8419.448 Mhz signal abruptly disappeared. At that very instant, Venus was being occluded by the Moon!
F5PL image
thumbnail

Click here for lots more pictures.


Click to email the Webmaster
email
the
Webmaster
| Home | General | Memb Svcs | Publications | Press | Technical | Internet | Index |
entire website copyright © The SETI League, Inc.; Maintained by Microcomm
this page last updated 20 December 2008
Click for top of page
Top of Page